Hi, I'm Agus
As a kid I wanted to be a writer. Since fiction wasn't my thing, I decided to start writing code instead.
Developer since 2016. I work with Node, Next, and React, and adapt to whatever the project needs.
There's always a story hidden in the data.

As a kid I wanted to be a writer. Since fiction wasn't my thing, I decided to start writing code instead.
I've been a developer since 2016. I mostly work with Node, Next, and React but I adapt to whatever is needed. I use D3, Mapbox, Scrollama, and any library that lets us tell a story in a vivid, engaging way. The projects I enjoy most are the ones that let me build animations, interactive data visualizations, maps, and scrollytellings.
Frontend or backend? I want both. I have experience with PHP (Symfony, Laravel, and CakePHP) and a bit of Python. If we need to write queries against a database (MySQL, MariaDB, PostgreSQL, MSSQL)… we write them!
I believe telling a story sometimes means building the whole system that makes it possible. That's why I also have experience with server management, deployment processes (CI/CD), and Docker.
There's always a story waiting to be told. The ones I like telling most are those I feel can have social impact. The topics I'm most interested in are inequality (gender, class, ability), access to information, sustainability, urban planning, and mobility, among others.
A good story is built by people.
My first steps as a dev were on the IT Solutions Development team at FRBA UTN. I learned a lot and we built many internal systems for the faculty: a scholarship system, a student enrollment system, an attendance system, and more.
I spent four incredible years as a developer on the El Gato y La Caja team, where we worked on projects with huge impact. Something truly special about El Gato y La Caja was being part of initiatives that moved me and mobilized me — and that still shape who I am today.
I currently work as a developer at Sociopúblico, a communications agency focused on improving public life.
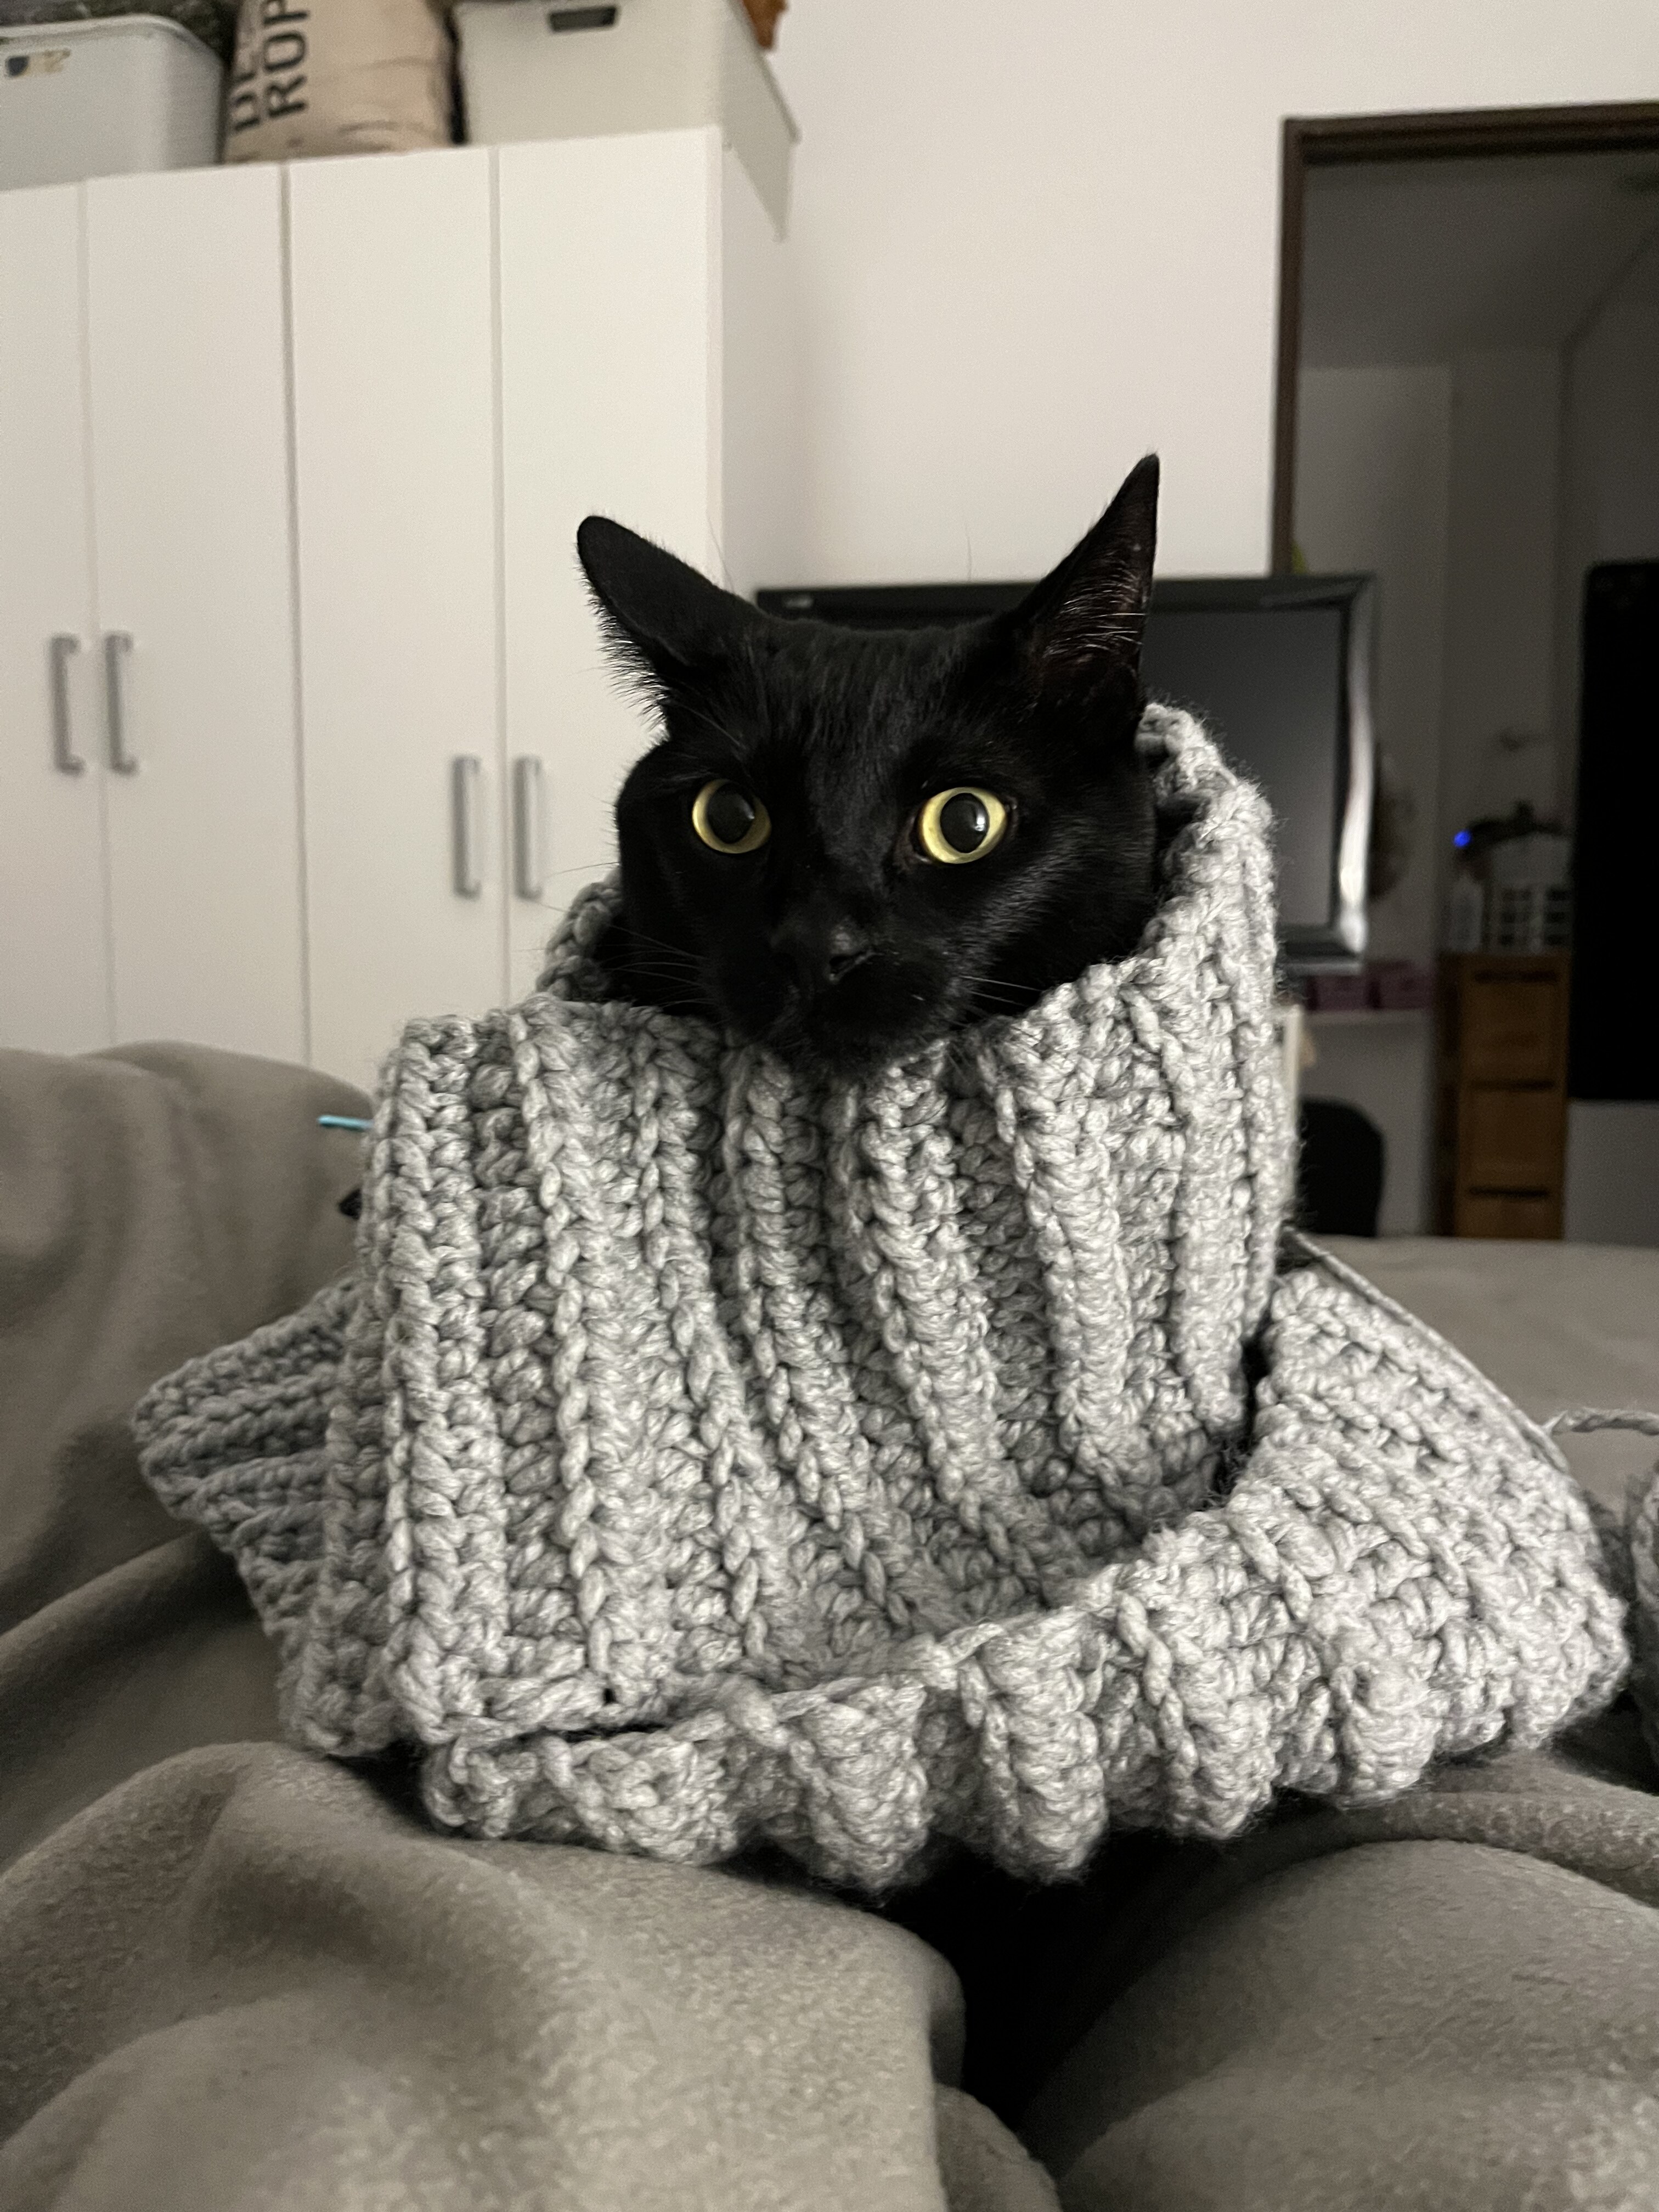
I'm a restless person. I love going to the movies, riding my bike, I read a lot, and I crochet. I have a Spotify playlist for every place and occasion. I'm studying Information Systems Engineering and I'm very close to graduating. I have a pet named Galileo who thinks he's a baby kitten but he's 8 years old and huge.
Sociopúblico
I work at a communications agency focused on improving public life. I build digital projects where information, narrative, and social impact intersect.
El Gato y La Caja
I took part in high-impact projects on a team that left a mark on me. I got to build initiatives that moved and mobilized me — and that still shape who I am today.
Desarrollo de Soluciones Informáticas · FRBA UTN
I learned a lot building internal systems for the faculty: scholarships, student enrollment, attendance tracking, and more. That's where I started to understand that code is also a way to tell — and to serve.
Developer since 2016
Some of the projects I really enjoyed building.
Communications agency · current role
Digital projects where information, narrative, and public life intersect.
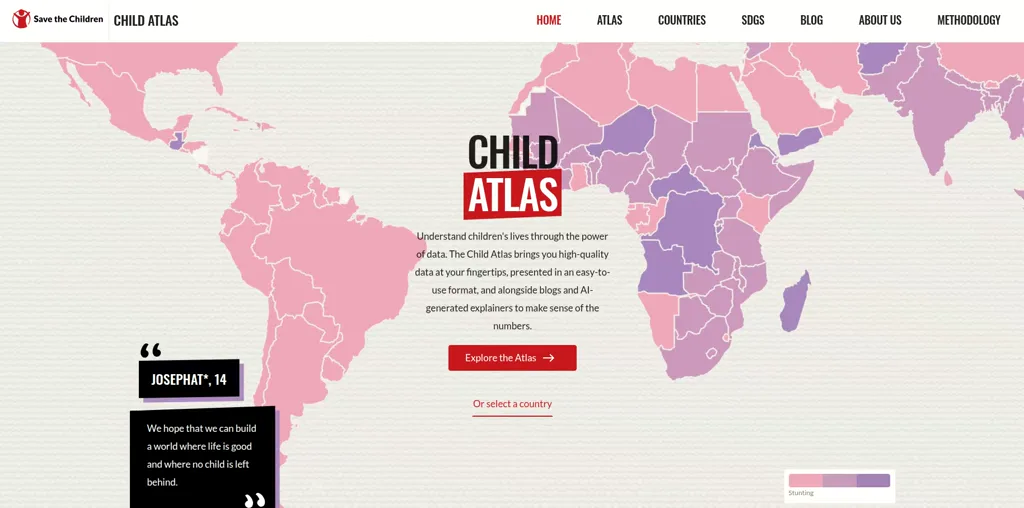
Save The Children asked us to build a data portal on the global situation of children to inform society about children's conditions worldwide and promote the protection of their rights. We built a home page, an interactive atlas, and country profiles to explore 100+ indicators on children's situations around the world.
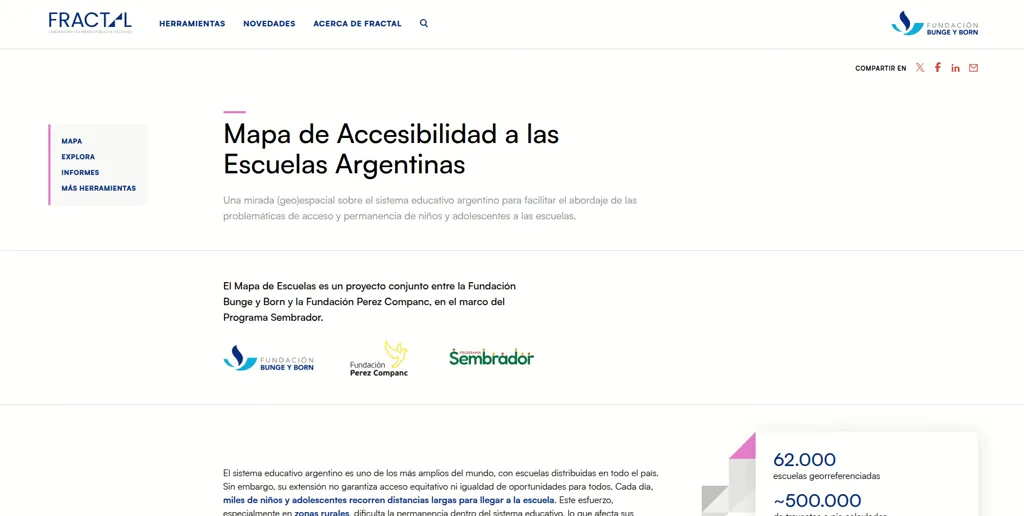
Fractal (a division of Fundación B&B) wanted to inform society about travel time for children to reach schools across the country and promote better accessibility to educational facilities.
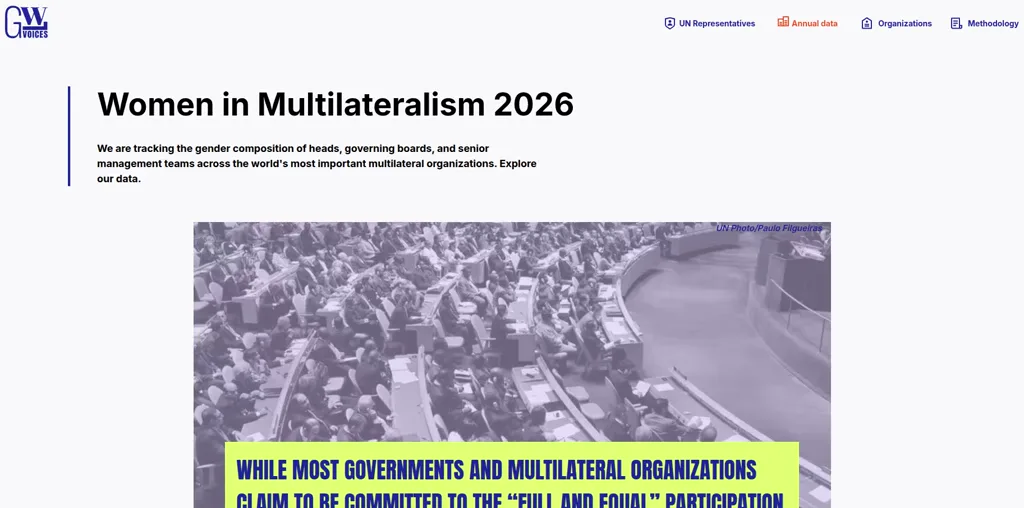
GWL asked us to build an interactive scrollytelling to tell the story of women in multilateral organizations in a visual, dynamic way.
04
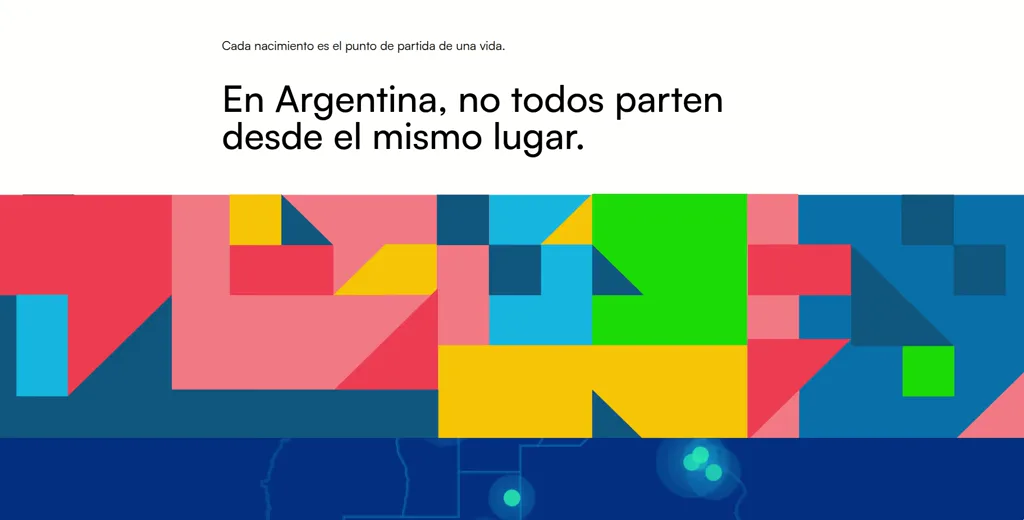
Interactive scrollytelling about the NIDO index.
Fractal (a division of Fundación B&B) asked us to build an interactive scrollytelling to tell the story of the NIDO index in a visual, dynamic way. The NIDO index measures four dimensions: access to education, health, access to green spaces, and context. Through this scrollytelling, we told the story of each dimension and how the index relates to children's daily lives in the country.
Four years of impactful projects
Animations, visualizations, maps, and scrollytellings — stories with social meaning.
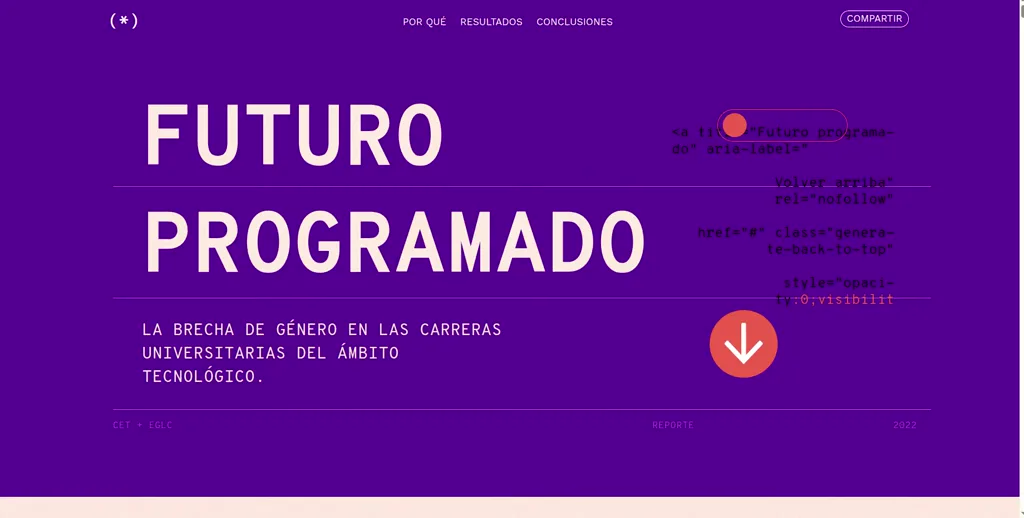
CET asked us to build an interactive scrollytelling to analyze the situation of women in technology and understand where the gender gap in STEM comes from. I really enjoyed this project because, as a woman in tech, I think it's important to keep encouraging more women to pursue this career.
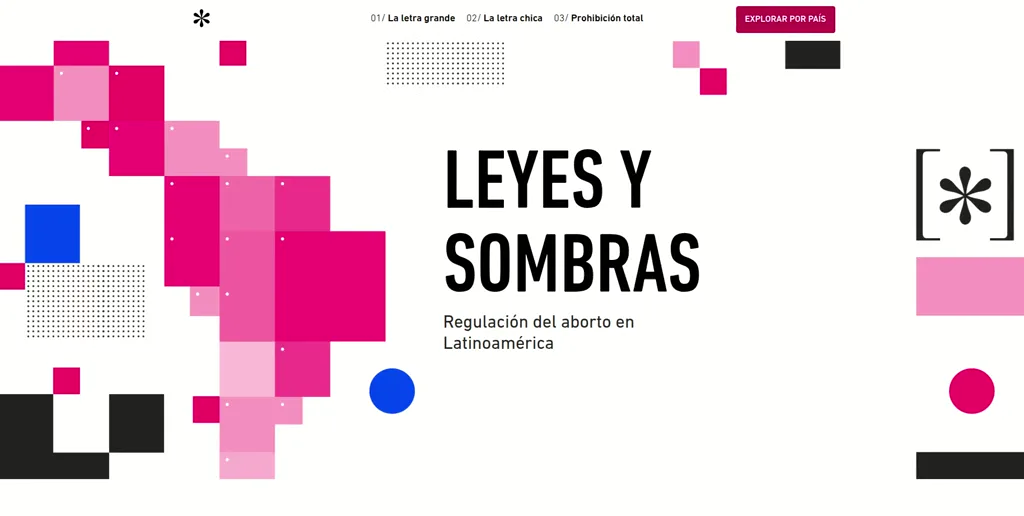
CLACAI asked us to build an interactive scrollytelling to analyze access to abortion rights across Latin America. The project explores the nuances of abortion access in each country in the region.
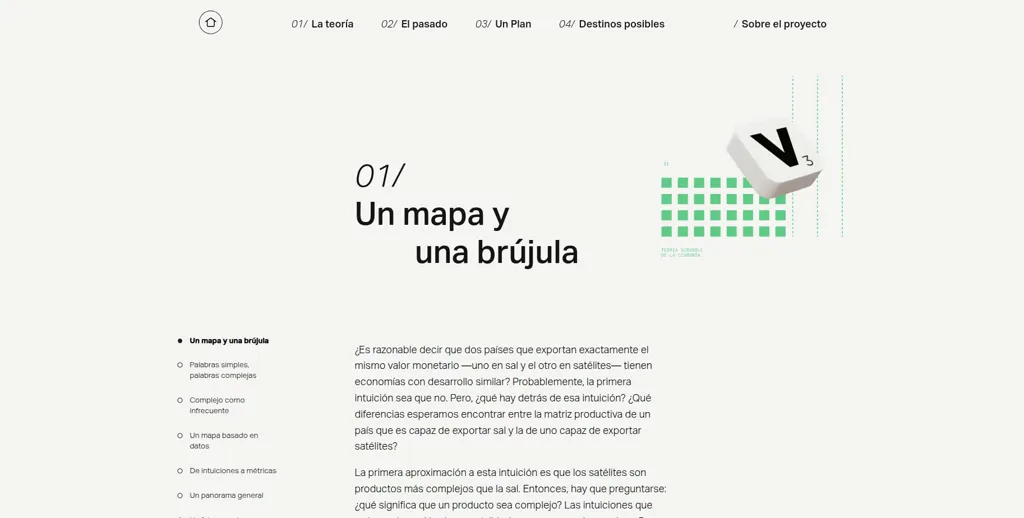
Fundar wanted an interactive scrollytelling to tell the story of a green economic proposal for Argentina — a path for the country to develop industrially in sustainable products with complexity suited to its current industrial capacity.
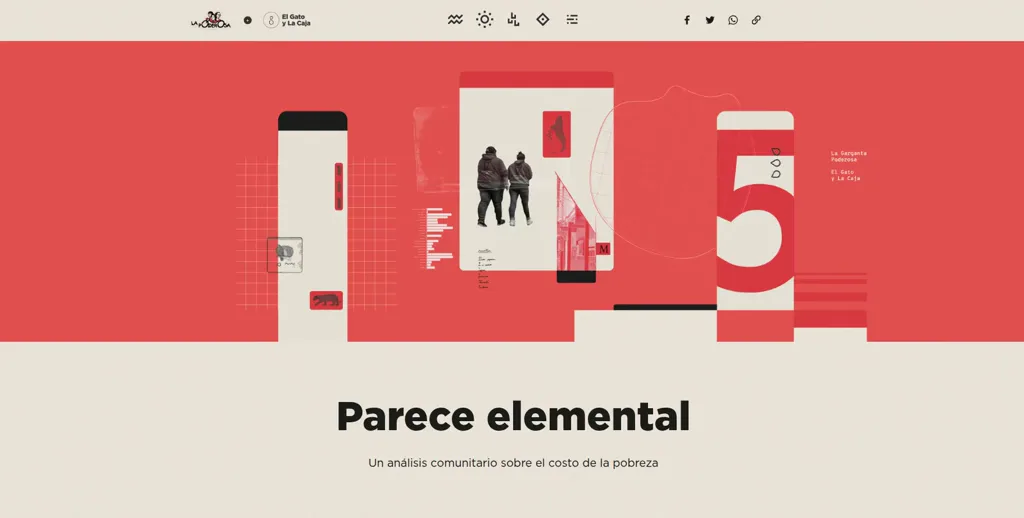
La Poderosa analyzed access to basic services in vulnerable neighborhoods across the country and asked us to build an interactive scrollytelling to tell that story in a visual, dynamic way.
Projects with other teams and clients
Projects that don't fit the other categories but I still really enjoyed building.
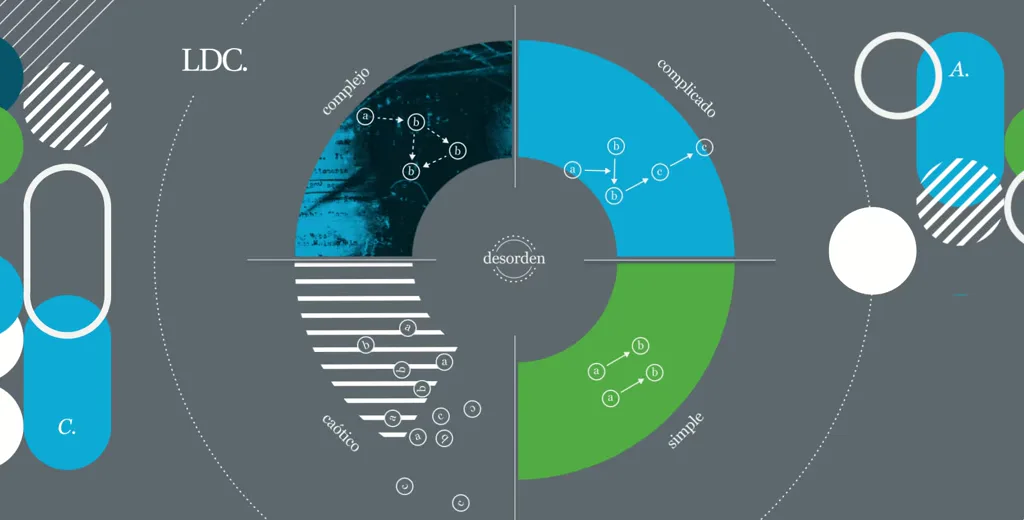
Together with De Supernova, we built an interactive visualization to learn about the Cynefin framework — a project aimed at informing society about the framework and promoting better project management.
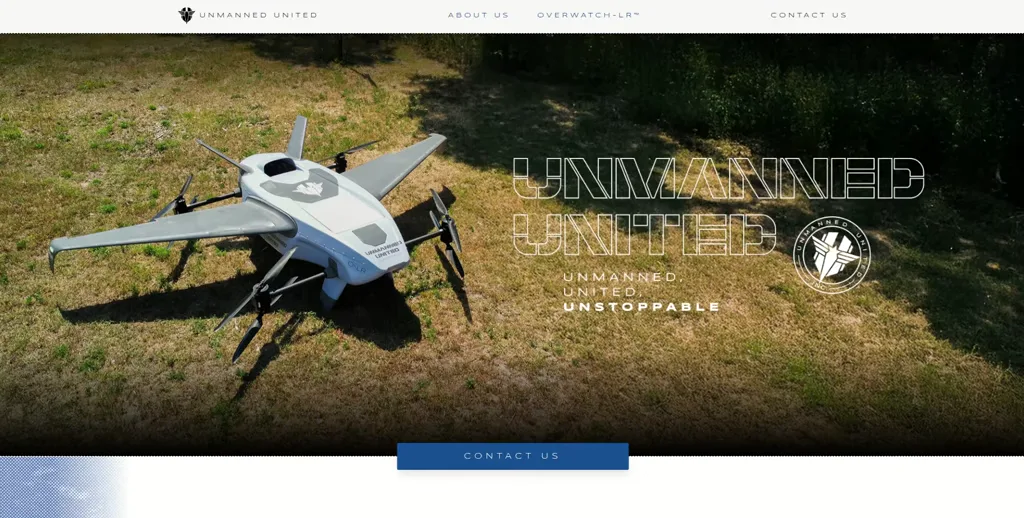
Unmanned United is a drone engineering company. I built their landing page to present their work and services.
Experiments, curiosities, and things I do for fun
Projects with no brief or deadline — space to try ideas and play with data.
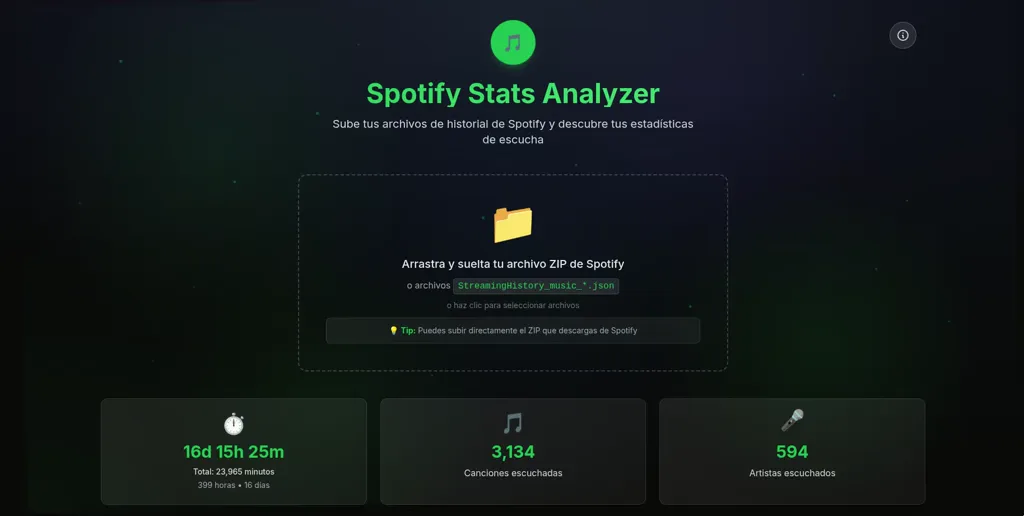
I didn't fully trust Spotify Wrapped, so I made my own visualizations. I downloaded my Spotify data and built views on my listening habits that Spotify wouldn't have offered otherwise.
02
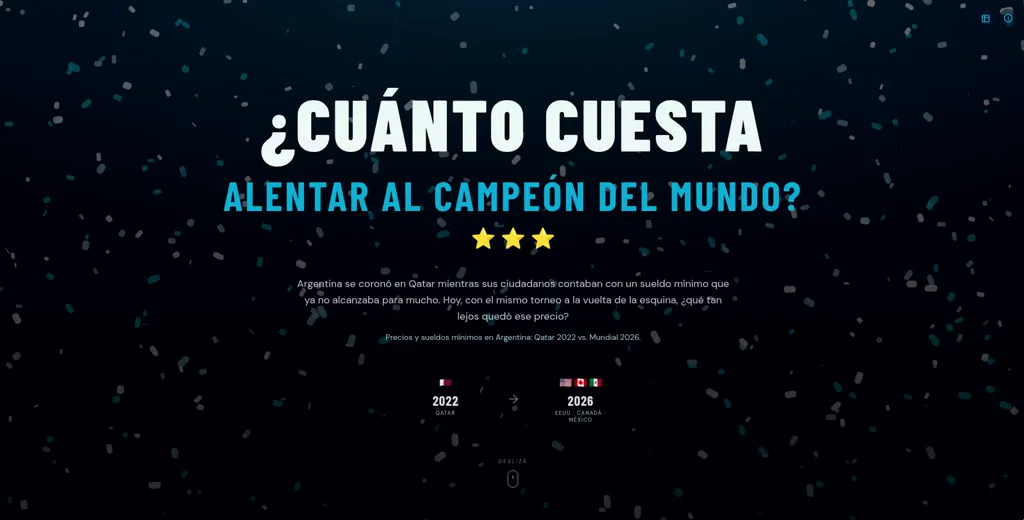
Interactive visualization on the cost of being world champion.
How much does it cost to be world champion? is an interactive visualization comparing the cost of living when Argentina won the World Cup vs. this tournament (2026).
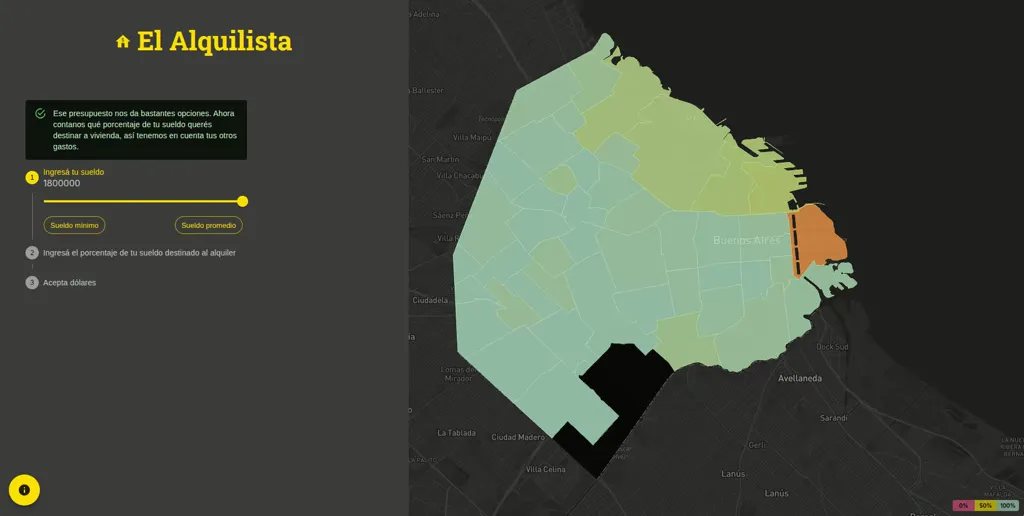
Alquilista is an interactive visualization on rent in Argentina in 2024. It analyzes the ability to rent an apartment in Buenos Aires based on salaries in Argentina.
Tools and technical areas I usually work in — not meant to be an exhaustive list.